
PowerPoint is the most commonly used medium to create presentations in business. However, many presenters are stuck with traditional Analytics shapes in presenting. This design aims to help presenters get creative ideas to present their business data concepts visually.
The slides tell the audience a lot about the presenter’s approach to presentations. by using Morph Transition you can make good and professional Slides
So go ahead, and enjoy going through these professional and advanced PowerPoint tutorials.
About this PowerPoint Infographic
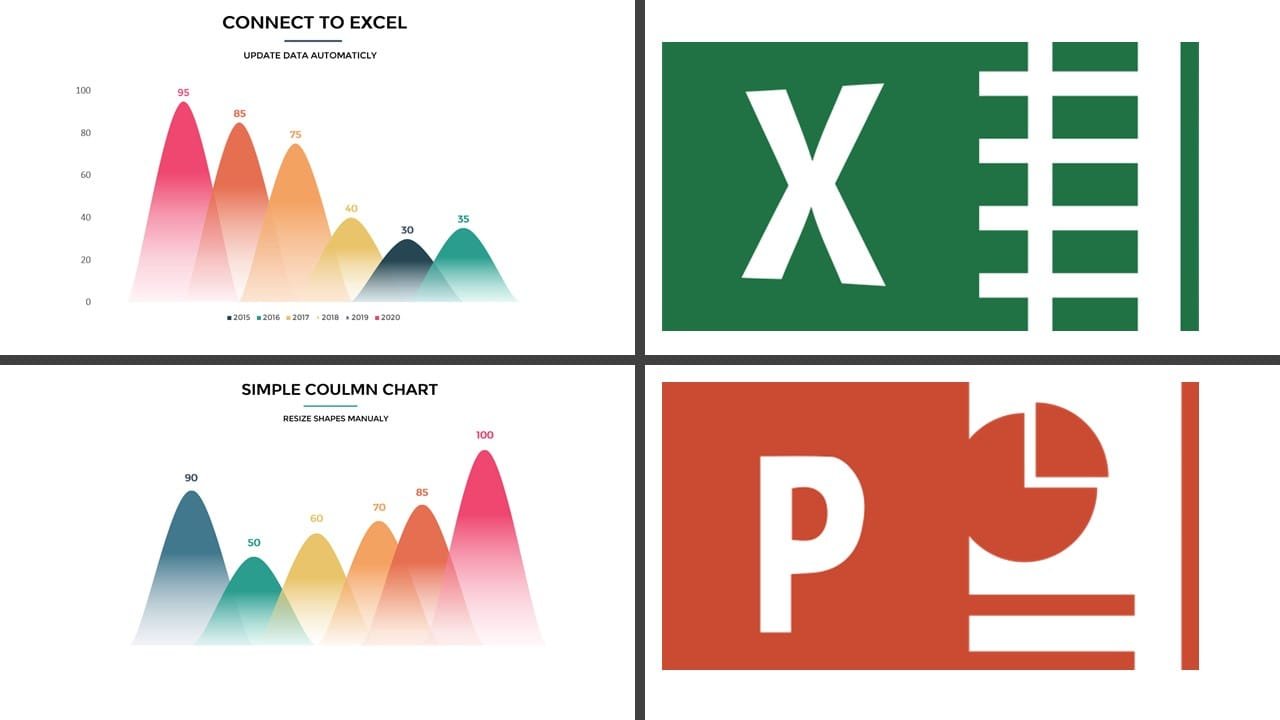
In this PowerPoint animation tutorial, you will learn how to create and animate charts in PowerPoint. We will create custom belly shapes for our charts and first, we will create a simple chart, where you can resize each column manually. Next, we will create a more advanced chart, which is connected to Excel and updates automatically
This PowerPoint presentation slide can easily make your audience surprise. And also it is considered as the best work which has been done by the PowerPoint softgrame. animated chart overcomes the routine show with wonderful animation As it is a multipurpose PowerPoint template, you can use it in any type of presentation. Moreover, It designed to used as Infographic with animation Effect
Features of this template
- 2 presentation slide
- Attractive color combination
- Shadow Effect s included
- Background Colour included
- Banner or presentation slide
Watch the tutorial video
Follow this step by step tutorial to learn how to create a simple animated chart in PowerPoint.
This infographic consists of many shapes to combine the charts So you can use these PowerPoint graphics to present statistics. We add custom animation to each of the graphic elements so we can present each of the points one by one.
Click play to watch the video below.
Information about this template
Here, we are providing brief information about this PowerPoint presentation slide. After watching the tutorial video, you may read this short and simple article to get a clear idea.
Step 01 Design 6 element of simple chart
At first, you need to design 6 simple chart column type and divide into 6 sections with pretty colors Each part will represent the element to show
Step 02 Add a few shapes and Element text
In this template, we have used, triangle, line, and rectangle that have been used to Main elements of the presentation slide.
Step 03 Adding the Colors to each Part
in this step, you will add pretty colors to 6 elements with its bullets and lines
Step 04 Adding animation
If you have followed our tutorial video, you would get to know how we have added a different type of animation as follow:
- float up animation
- Fly-In animation
- Fade animation
Get this PowerPoint template
The best thing is that we are providing this awesome PowerPoint presentation slide for free of any cost. Can you imagine that? So, please show us your kind support for our hard works. If you click on the download button, you will get the file which contains the template file